

New data shows that essential workers were more likely to drive pickups according to new mileage data from the federal government. Prior to the pandemic, cars averaged more miles than trucks, but that changed significantly in 2020.
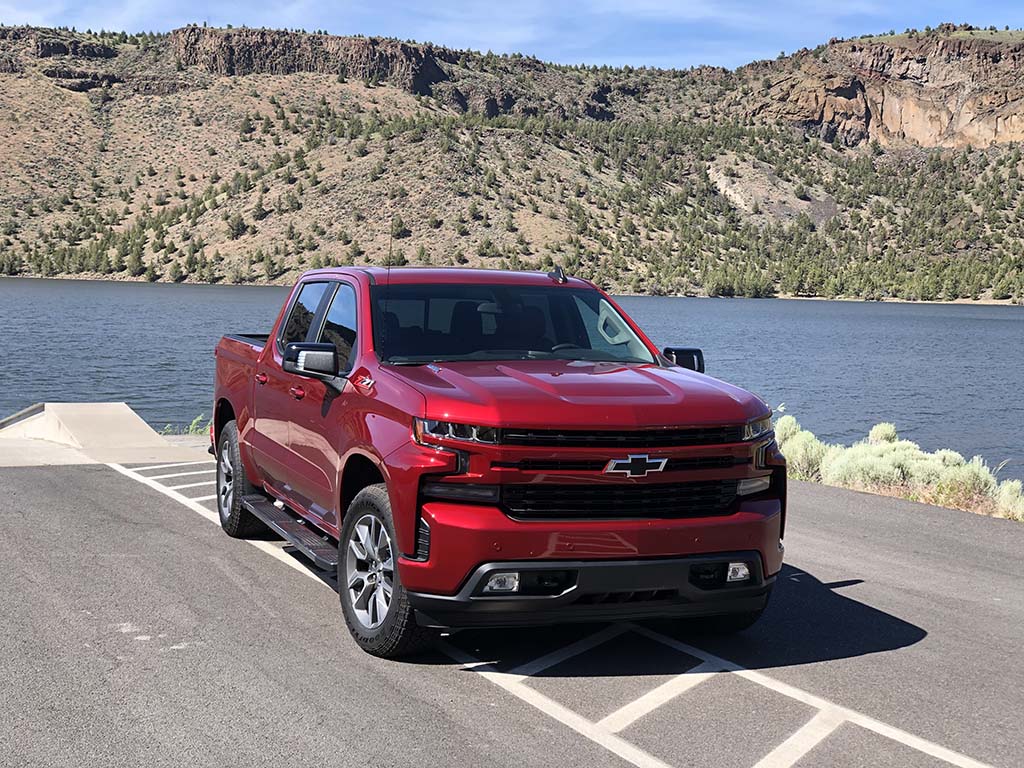
According to new data from the Federal Highway Administration, the annual average miles traveled by cars dropped 16% between 2019 and 2020, from 11,599 miles to 9,780 miles. Meanwhile, truck owners posted an increase of 1%, going from 11,263 miles on average to 11,355 miles.
“This leads me to assume that telecommuters are more likely to drive a car, while those who do not have the luxury of telecommuting, including many essential workers, are more likely to drive a light truck,” said Michael Sivak, managing director of Sivak Applied Research, which studies trends related to automotive commuting.
However, to the extent that some telecommuters do drive a light truck, they push the 2020 mileage of light trucks down. Conversely, to the extent that some non-telecommuters do drive a car, they pull the 2020 mileage of cars up.
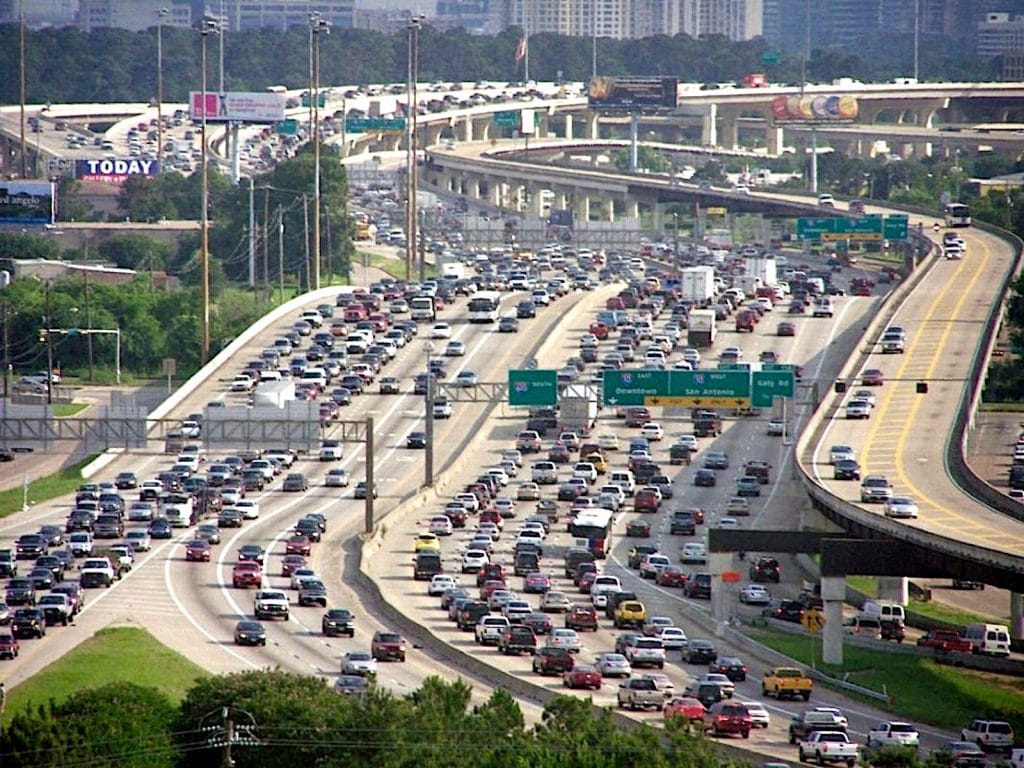
How much are we driving?
The figures for 2021 haven’t been released yet, although the agency said travel during November 2021 on all roads and streets in the nation increased by 12.3%, or 29.2 billion vehicle miles.
While traffic dipped significantly in 2020 due to the lockdowns and other efforts to limit exposure to the COVID-19 virus, the rebound may not be as swift as expected. According to FHWA data, motor vehicle travel in 2021 only passed 2020’s number in November.
U.S. motorists traveled an estimated 2.96 trillion miles through November. For all of 2020, the number was 2.90 trillion miles.
Upside to driving less
U.S. commuters lost 3.4 billion hours due to traffic congestion in 2021. While that may sound like a lot, it represents a 42% decline compared with the pre-COVID numbers from 2019, reported Inrix Inc., which provides transportation analytics and connected car services.

The average American, according to its 2021 Global Traffic Scorecard, lost 36 hours to traffic jams in 2021, which is a 10-hour increase compared with 2020, when many parts of the country were in the throes of severe pandemic-related restrictions. However, is still 63 hours better than 2019’s results.
Throughout the pandemic, San Francisco (-49%), Detroit (-41%), and Washington, D.C. (-38%) have continued to see significant reductions downtown trips, yet San Antonio (-5%), Tampa (-6%) and Phoenix (-7%) inched closer to pre-COVID levels. Nationwide, trips to downtowns decreased -22% versus pre-COVID levels.
Drivers in Chicago (104 hours), New York (102 hours) and Philadelphia (90 hours) lost the most time to traffic congestion in 2021 despite being -27% to -37% below 2019 levels, Inrix reported. Fourth-ranked Boston (78 hours), ranked first in 2019 Traffic Scorecard with 101 hours lost, lagged pre-COVID levels by -47%. Washington, D.C.’s congestion levels remained -65% below normal, the largest decline of large U.S. cities and the surrounding suburbs.